Us average salary
When people outside the United States think about Americans, many imagine a land of wealth and equality, where everyone drives nice cars, lives in comfortable homes, and enjoys a high standard of living. However, the reality is far more complex. The United States is a nation marked by significant economic differences—not just between the rich and poor, but also between the regions (states). Where you live in the U.S. can dramatically affect how much you earn. The new data on average hourly earnings by state in 2025 provides a clear picture of this inequality.
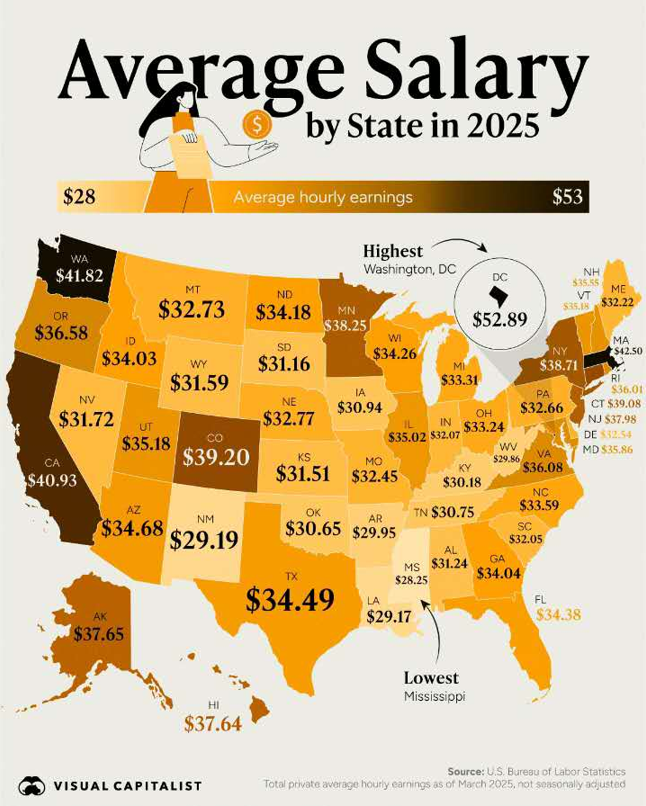
According to the U.S. Bureau of Labor Statistics, the national range of hourly wages across states spans from 28.25 dollars in Mississippi (the lowest) to 52.89 dollars in Washington, D.C. (the highest). This means that someone working full-time in D.C. might earn almost twice as much as someone in Mississippi, even if they work the same number of hours. Let’s dive into this salary map and explore what it reveals about income disparities in the United States.
The Wealthy Pockets: Washington, D.C. and Coastal States
At the top of the chart is Washington, D.C., with an impressive average hourly wage of 52.89 dollars. This isn’t surprising—D.C. is home to countless federal agencies, international organizations, law firms, and consulting companies. It’s a hub of highly educated professionals and elite government officials.
Other high-earning areas include Massachusetts (42.50), Washington state (41.82), and California (40.35). These coastal regions are known for their booming tech sectors, strong educational institutions, and high costs of living. For example, in California, the presence of Silicon Valley and major entertainment industries inflates wages.
In the Northeast, Connecticut (39.08), New Jersey (37.98), and New York (38.71) also stand out. These are finance, legal, and media powerhouses that often attract highly paid professionals.
Middle-Tier States: The American Heartland and South
Many states fall into the mid-range category, with hourly wages between 30 and 36 dollars. These include Texas (34.49), Florida (34.38), and Georgia (34.04). While these states don’t match the salaries of coastal giants, they benefit from a lower cost of living and fast-growing job markets in industries like logistics, energy, and manufacturing.
In the Midwest, Illinois stands out with 38.71 dollars, likely influenced by Chicago’s urban economy. However, neighboring states like Indiana (33.06) and Iowa (33.02) show that the industrial heartland still pays decent but not outstanding wages.
The Struggling South: Income Disparity and Economic Challenges
At the bottom of the wage scale are several Southern states. The lowest is Mississippi, with an average hourly wage of 28.25 dollars. Louisiana (29.17) and New Mexico (29.19) follow closely behind.
These states tend to have higher poverty rates, lower education levels, and fewer high-tech or high-wage industries. Many workers are employed in agriculture, retail, or service industries that typically offer lower pay. Additionally, weak labor protections and lack of unionization often contribute to lower earnings.
What Explains the Differences?
Several factors contribute to why some states pay more than others:
* Cost of Living: Areas like D.C., California, and Massachusetts are expensive to live in. Employers must offer higher salaries to attract and retain talent.
* Industry Presence: States with strong tech, finance, or government sectors tend to offer better pay. In contrast, states relying on agriculture or tourism often have lower wages.
* Education and Skills: States with higher education levels tend to have a more skilled workforce, leading to better-paying jobs.
* Policy and Labor Laws: States with stronger minimum wage laws, worker protections, or union presence may also see higher average earnings.
Why This Matters?
Understanding these differences is essential for several reasons:
* For workers, it affects job opportunities and life planning. A person earning 28 dollars an hour in Mississippi might consider moving to a higher-paying state—but must also consider the higher cost of living.
* For businesses, wage differences can influence where they choose to expand or relocate.
* For policymakers, this data highlights the need to reduce income inequality and ensure that economic growth benefits all regions of the country.
Conclusion: One Nation, Many Realities
The United States is often thought of as a wealthy country—but not all Americans experience that wealth equally. This map of hourly salaries by state in 2025 reminds us that economic opportunity is deeply tied to geography. The difference between earning 28 and 53 dollars per hour can mean the difference between living paycheck to paycheck or building a comfortable life. As America continues to evolve, bridging these income gaps will be one of the major challenges of the its future.
https://www.census.gov/library/publications/2023/demo/p60-279.html
https://data.oecd.org/inequality/income-inequality.htm
https://www.visualcapitalist.com/average-salary-by-state-in-2025


1 thought on “Not All Americans Earn the Same: A Look at Hourly Salaries by U.S. State in 2025”